Stray Light Mitigation
In addition to designing complex, diffraction limited lenses, Navitar has developed considerable stray light expertise during the development of autonomous vehicle automotive lenses (fixed focus, athermalized, wide temperature range). This technical capability is now being applied to a wide range of areas from drone development, agriculture cameras, defense guidance systems, soldier situational awareness, mixed reality smart glasses, outdoor facial recognition and more. Navitar has the engineering design capabilities and production experience to meet your demanding custom lens requirements.
All Navitar custom HDR lenses are designed and built with stay light mitigation design know-how and manufacturing processes. Effects of stray light are usually observed either as ghost images (of either the bright source object or the lens aperture) or as a background glare (veiling glare).
Ghost images are the result of multiple (usually double) reflections from the optical surfaces, including the IR filter, sensor cover glass and the sensor surface itself.
Veiling glare originates from the same sources as ghosts plus internal scatter from metalwork, optical surface roughness and optical surface contamination.
Stray light characteristics of a lens can be modelled, and simulations are found to be reliable provided the necessary inputs to the optical model are known.
Mitigation of stray light involves control of the following parameters:
Optical Design
The chance of a double reflection causing a ghost image (or just contributing to glare) increases with the number of surfaces in the lens according to:
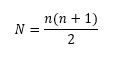
Where N is the number of possible two-surface reflections and n is the number of surfaces (including the sensor). Hence, a lens designed with fewer surfaces will have less stray light. Where possible, doublets reduce the number of surfaces as can the use of aspheres.
In addition, we can apply certain optical design know-how to ensure the remaining double reflections are sufficiently defocused to reduce the irradiance of stray light on the sensor.
Optical Coatings
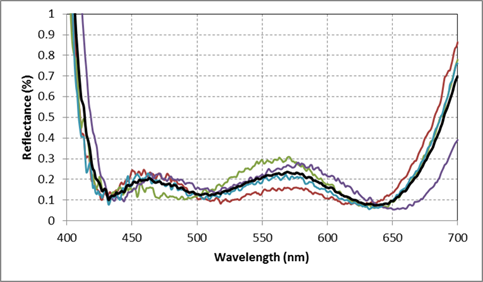
High performance optical coatings are applied to the surfaces to reduce the reflectivity to less than about 0.2%. By taking as-built reflectance data we recreate the as-built performance in the model (Fig 2) to simulate the realistic stray light contribution.
Optical Surfaces
The effect of scattering due to surface roughness is expressed using a bidirectional scattering distribution function (BSDF). The equation below shows, BSDF is a function of wavelength, input beam angle and scattering angle and surface roughness (expressed as a power spectral density). BSDF is a measure of the relative power scattered into incremental solid angles (i.e. relative radiance).
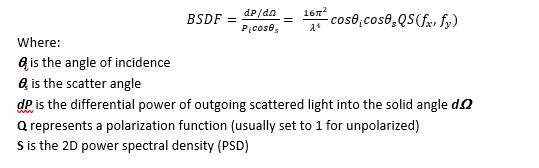
Integrating the BSDF over all angles results in the total integrated scatter (TIS), which is also related to the rms surface roughness, refractive index, and wavelength.
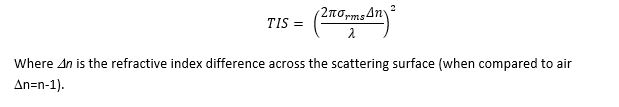
The above equation shows that scattering increases as the square of surface roughness and increases for high refractive index materials.
Mechanical Surfaces
Scatter from metal surfaces is also modelled using BSDF data. Navitar has built a comprehensive database of materials scattering properties based on measured scatter at a range of wavelengths. Materials include:
- Aluminum 6061 coated, black anodized
- Aluminum 6061 coated, bead blasted, black anodize
- Stainless steel 303 raw
- Stainless steel 316 raw
- Stainless steel 303 black oxide
- Stainless steel 316 black oxide
- Brass UNS C36000 Black oxide
- Ultem 2300 EEI30 Raw
*Titanium is one material not yet in the database but is in the process of being tested.
Measured BSDF data is input to the optical model to enable simulation of the scattering in a lens.
As an example, Figure 5 shows the measured scatter data for anodized aluminum 6061 with and without bead blasting. Figure 6 shows that data input into the simple optical model and the scatter simulated.
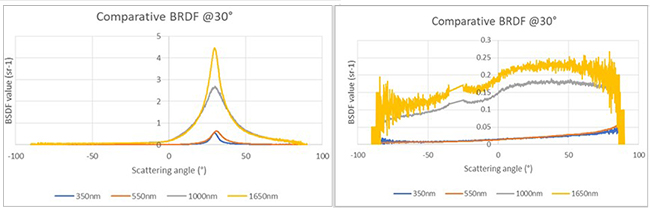
Figure 5: Optical scatter measured data for anodized aluminum 6061(untreated, left and bead blasted, right) at various wavelengths at 30° incidence
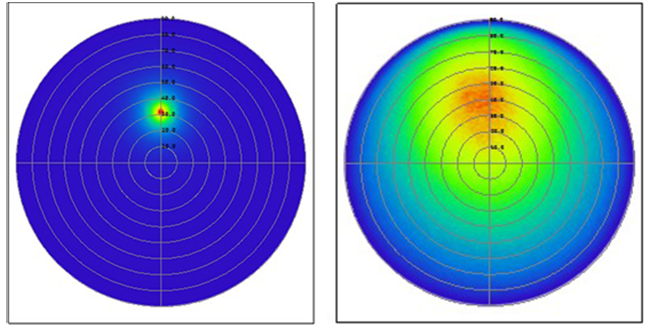
Figure 6: Optical scatter simulation based on measured data for anodized aluminum 6061 (untreated, left and bead blasted, right) at 550nm at 30° incidence
Having detailed data like this enables appropriate selection of materials and surface treatments for a particular application and allows us to predict the extent of stray light in the final system.
Complete System Simulation
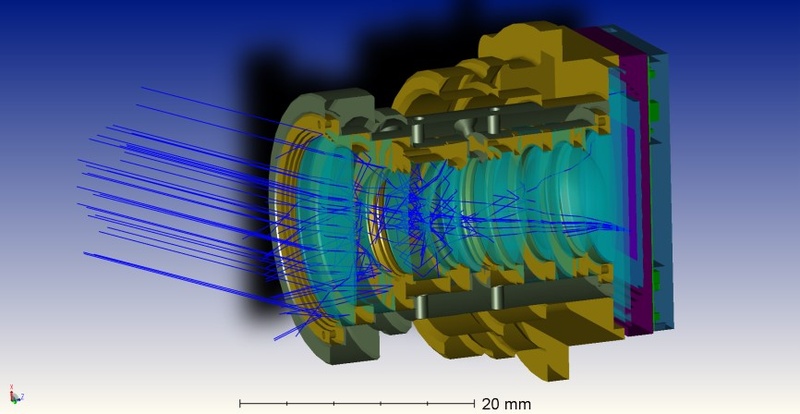
Once all the material characteristics are input into the lens optical model, we can simulate the effect of a bright source in-field and out-of-field. Figure 7 shows a 3D rendering of this complete system simulation.
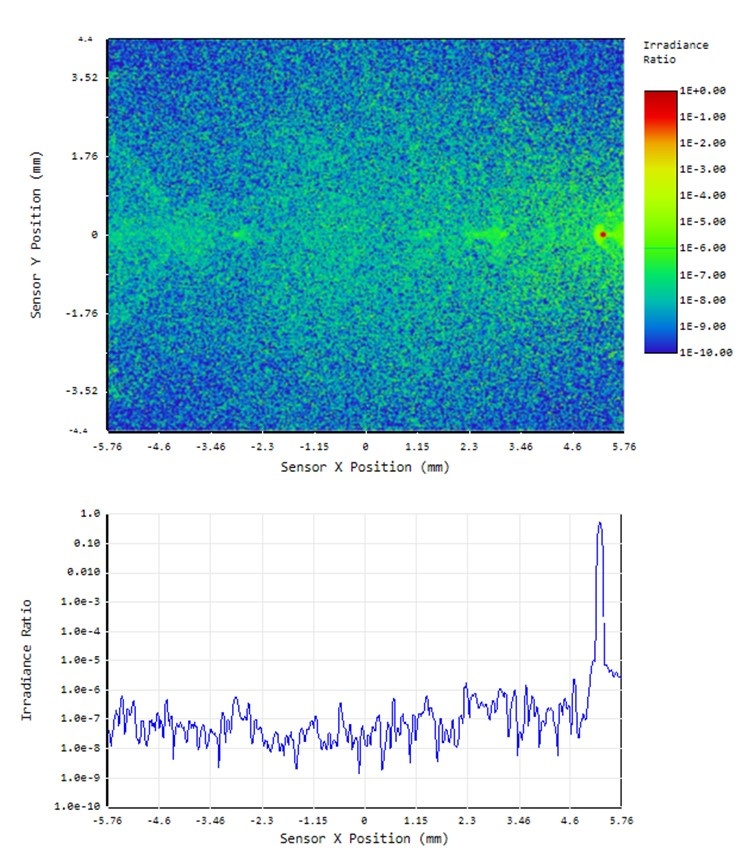
An example result of a stray light simulation is shown in Figure 8, which is often referred to as a Glare Spread Function. In this example the source is at 30° and appears at almost the right-hand edge of the sensor.
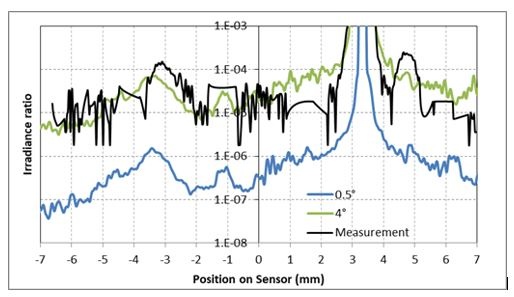
It should be noted that the glare for a given lens/camera is a function of the source angular subtense. Figure 9 shows the same lens analyzed with a solar source (0.5°) and a 4° source. The 4° source is the standard source on the Trioptics ImageMaster tool. Figure 9 shows the excellent correlation between measurement and simulation provided the simulation has the same source angular subtense.
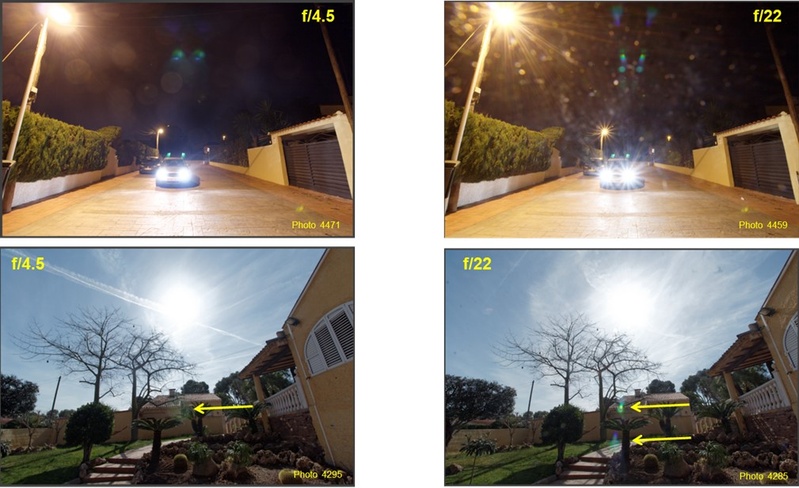
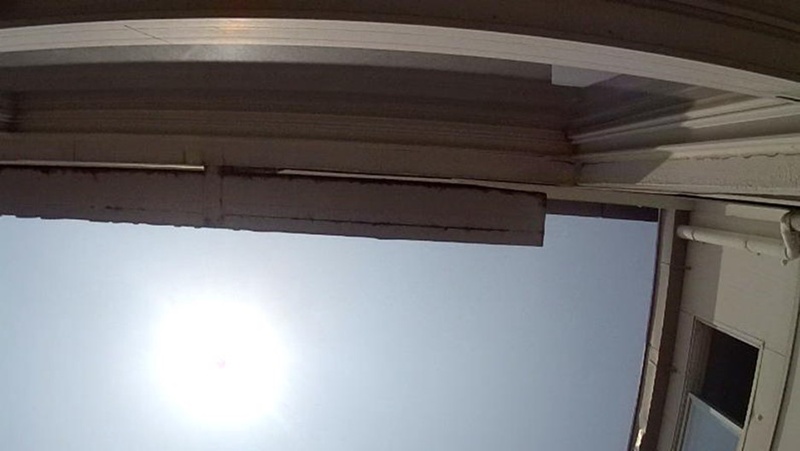
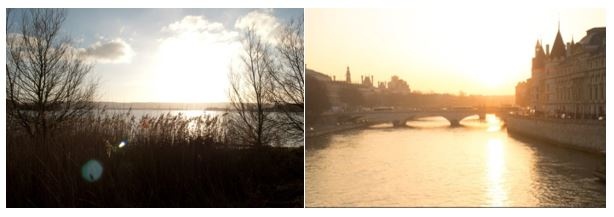
Another parameter which affects stray light level is aperture. Figure 10 shows analogous day and night images at f/4.5 and f/22. These are taken with a commercial camera and show higher f/# images exhibit higher stray light levels. Most Navitar HDR lenses are in the region of f/1.8 - f/2.8.
Navitar has developed know-how to mitigate stray light. Figure 11 shows a test image from a wide-angle Iguana lens.